Earth observation of ecosystem properties in ecosystem service models
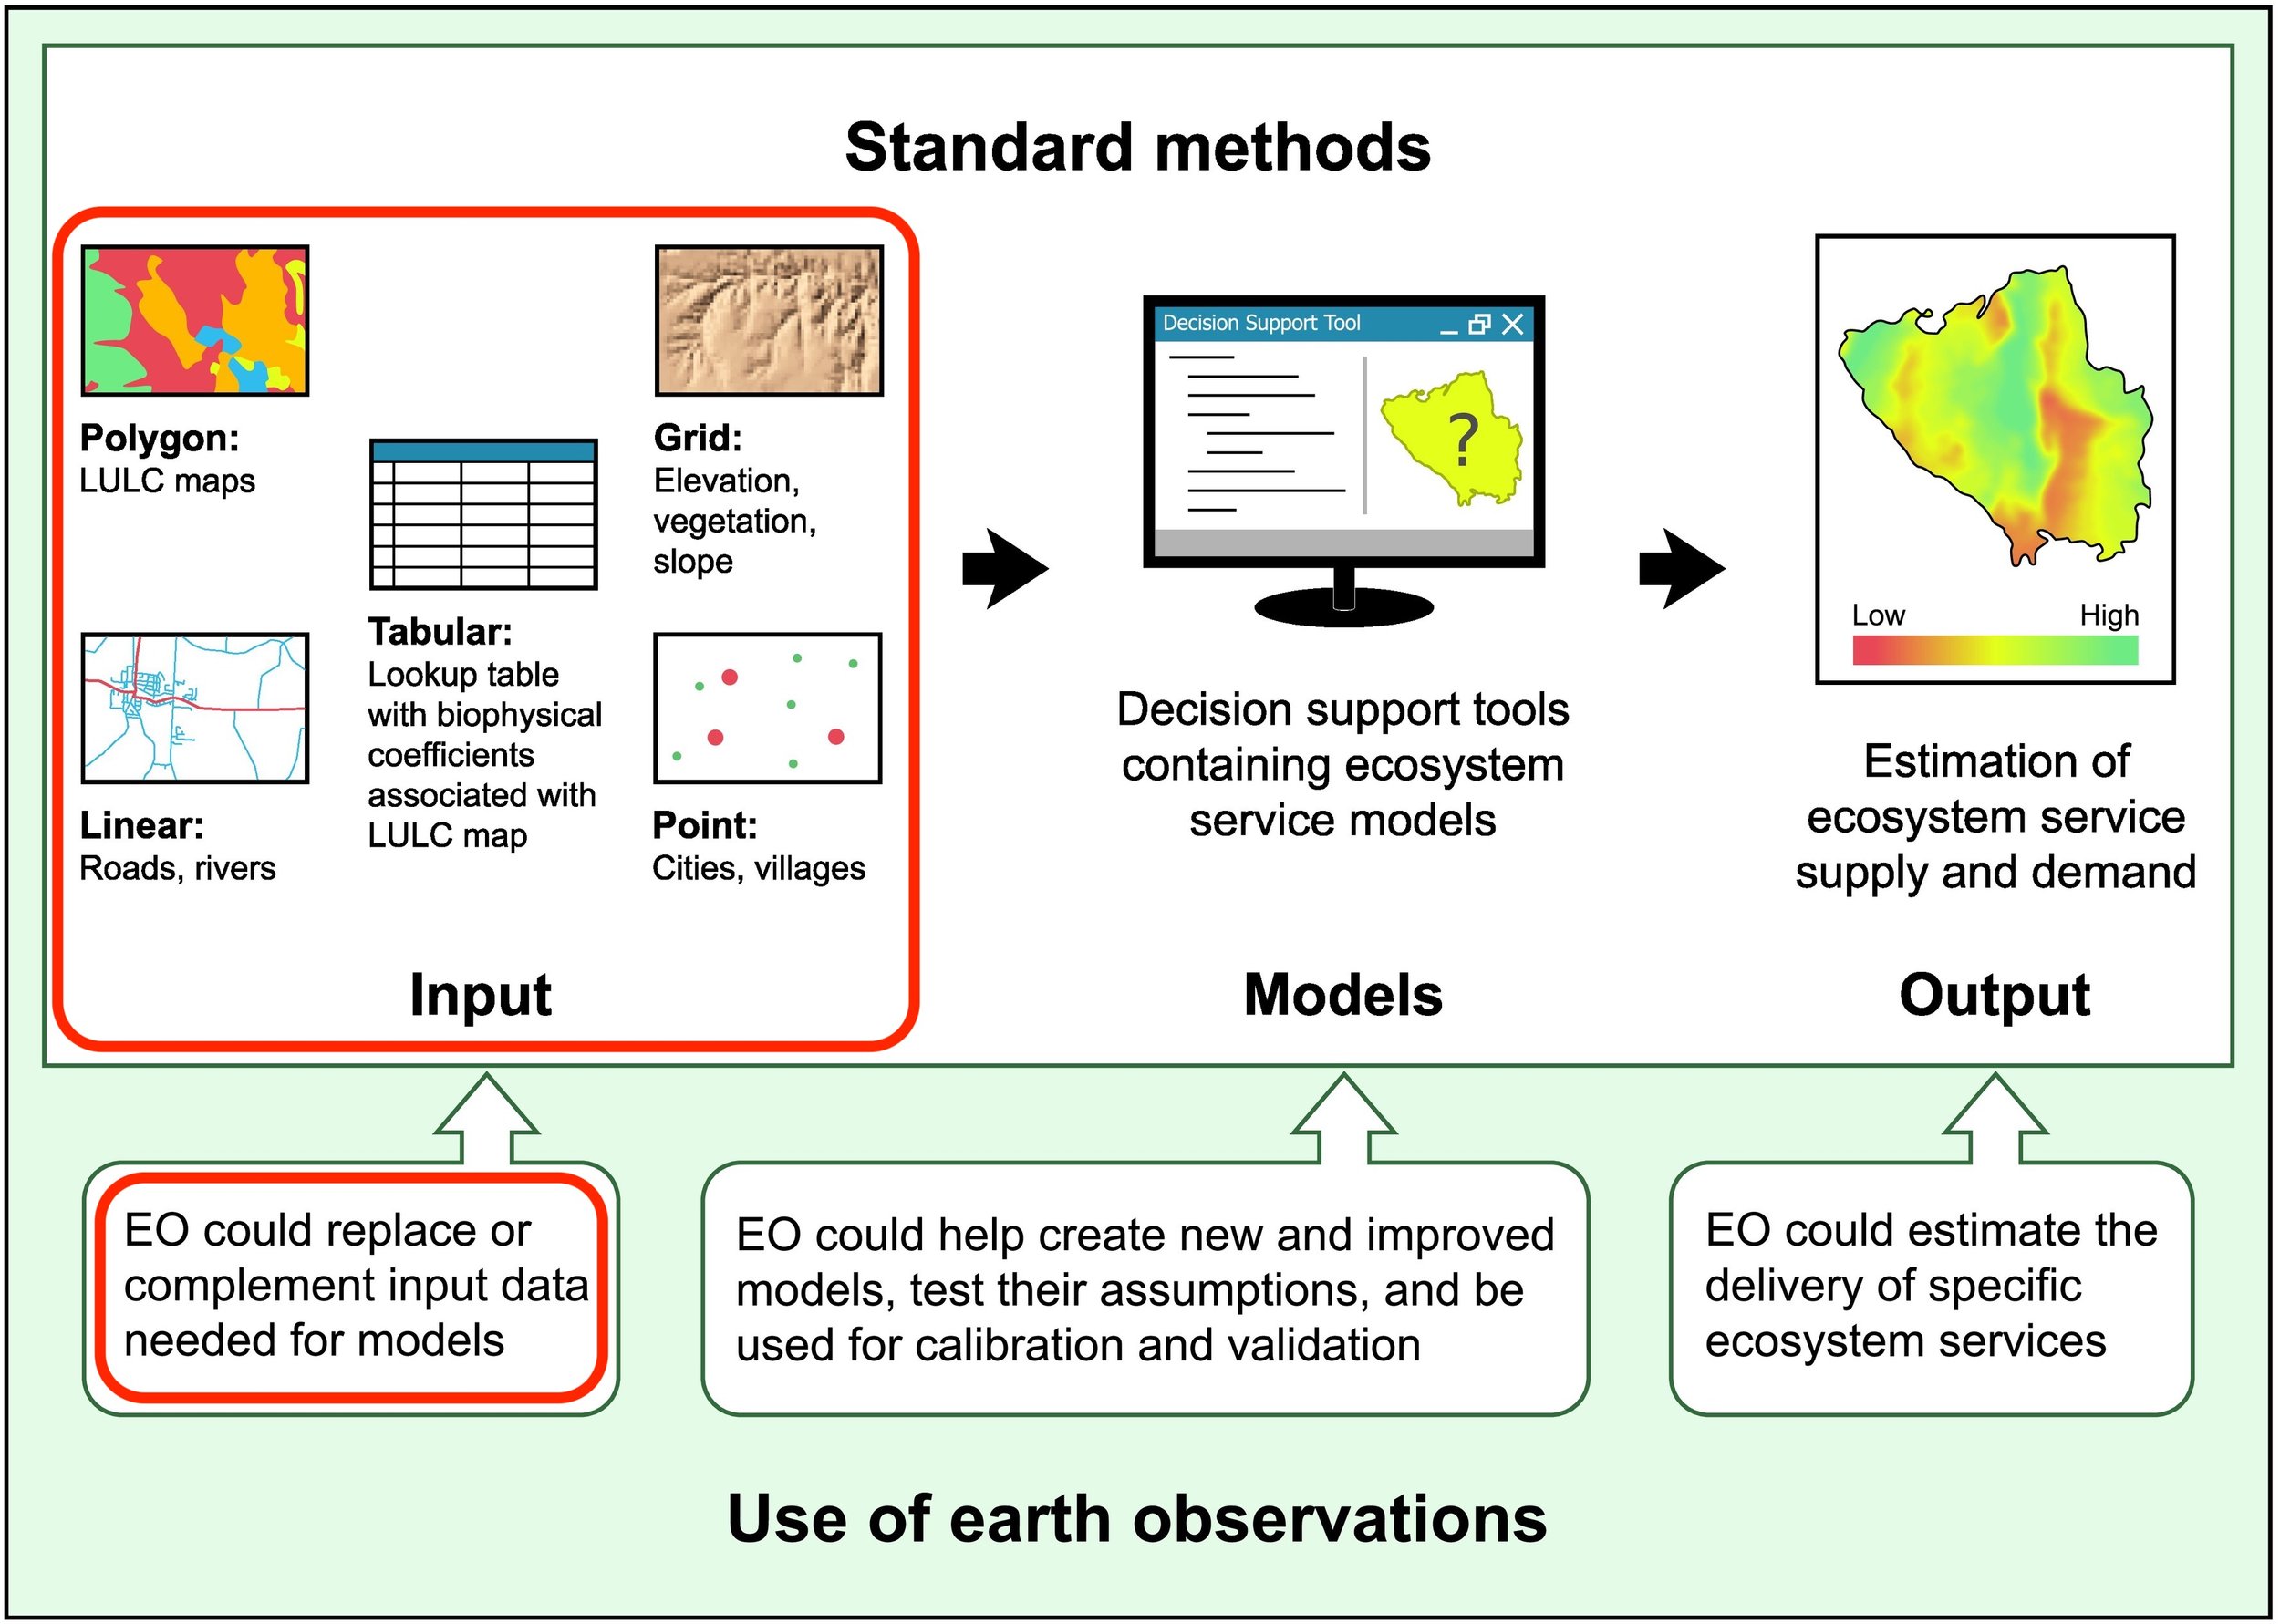
Figure from Ramirez-Reyes et al. (2019). Red box added to show the focus of this project is primarily on EO as an input to ES models.
Overview
What earth observation-based proxies of ecosystem structure and function are currently available at appropriate spatial extents and resolution for assessing ES? Furthermore, how do ES assessments differ when these different data sources are used as proxies for ecosystem properties? Many current ES models are based on categorical typologies of land-use and land-cover (LULC), with the assumption that most ecosystem properties within a LULC type are identical. This is often due to field data being scarce, expensive, difficult, and time-intensive to obtain across large areas; however modelling approaches that incorporate earth observation (EO) datasets may be able to capture proxies for ecosystem properties beyond LULC at finer spatial and temporal resolutions, thus representing ecosystem heterogeneity more precisely. This project explores how the ES community has used EO data to assess ES over the past ten years, and further uses a case study approach to look at the implications of data choices for ES assessment.
Approach
In the first part of this project, we systematically reviewed the use of EO data in ES models over the past ten years of ES literature, highlighting which EO datasets, at which geographical extent and spatial/temporal resolutions, have been used in ES models. This review, which only examines papers that include an applied use of EO to model specific ecosystems service(s), is intended to provide a snapshot the current state of the science around: 1) what EO-based metrics of ecosystem structure and function are currently available at appropriate scales for assessing ES, and 2) what ES models have been adapted to use EO-derived indicators ecosystem structure and function.
The second major component of this project looks at the sensitivity of ES model outputs to using different EO data inputs in the Montérégie region of Quebec, Canada. To explore the implications of choices made in selecting a data source (and the scale and resolution at which they are used), we are adapting our own ES models to evaluate the spatial scale sensitivity of three common ecosystem structure metrics (i.e., Normalized Difference Vegetation Index- NDVI, Enhanced Vegetation Index- EVI, and Land Use and Land Cover-LULC) and evaluate the differences in ES model outputs that use these three data sources as a proxy for ecosystem structure.
Key Findings
Sankey diagram showing links from specific EO data products to three common ES models (outdoor recreation, food production, soil retention). EO products can be classified under different monitoring schemes, such as the GEOBON Essential Biodiversity Variables (shown here on the right) to identify what the data is being used as a proxy for.
Sentinel-2 satellite image (bottom), LULC (top right), and NDVI (top left) in sub-area of Montérégie region of Quebec, Canada.
Project Lead: David Ferguson
Collaborators: E Bennett, K Winkler
What’s Next?
Assessing ecosystem services involves making choices around the indicators and proxies that are used. The results of this project can help to illuminate which Earth-Observation derived indicators and proxies are currently being used to assess ES, and shed some light on what the implications of different choices of indicators and proxies are. This work adds to the current conversation around developing common frameworks for monitoring ecosystems in a continues, consistent manner, whilst filling gaps in the spatial and temporal coverage of field-based observations. Larger projects and networks that this work closely aligns with, include NSERC ResNet, GEOBON, and StatsCan Census of Environment.


